
UN Open Data Portal
Redesign & reimplementation.
https://data.unops.org
About the project
UNOPS have a need to communicate openly about their projects and activities with multiple external stakeholder groups. It is important that this communication is as open and free as possible without compromising the operational security of colleagues, and suppliers, working in some of the most challenging contexts in the world.
Context
Working closely with multidisciplinary team of stakeholders the project aims to replace the hugely dated incumbent product with one that is visually fresher and with additional capabilities. Three key challenges are divergent needs from disparate personas, delivering a storytelling experience from essentially dry data & delivering a simple solution that is accessible for all.
Key Decisions
UNOPS user experience design philosophy is shaped by a heavy adoption of three key vendor ecosystems - Atlassian, Google and Salesforce. The conscious approach is one of reducing the perception of barriers between in-house products and vendor products. As Google’s Material has larger adoption, this is the default choice however with a key component of the project brief being to deliver a “visually stunning” product there was an early decision to move away from the organisational default and to build a visual identity that pushed the boundaries of the organisational brand book without crossing them.
Role
In this project I’ve taken a hands off approach to the design acting purely in a design direction & consultancy role. In parallel to this I’ve advised on the feasibility of technical implementation and rapidly prototyped some of the designers’ concepts to pathfind for the development resource. This has been particularly useful for aspects of motion design where there was communication challenges due to the limitations of Figma prototyping.
Changes
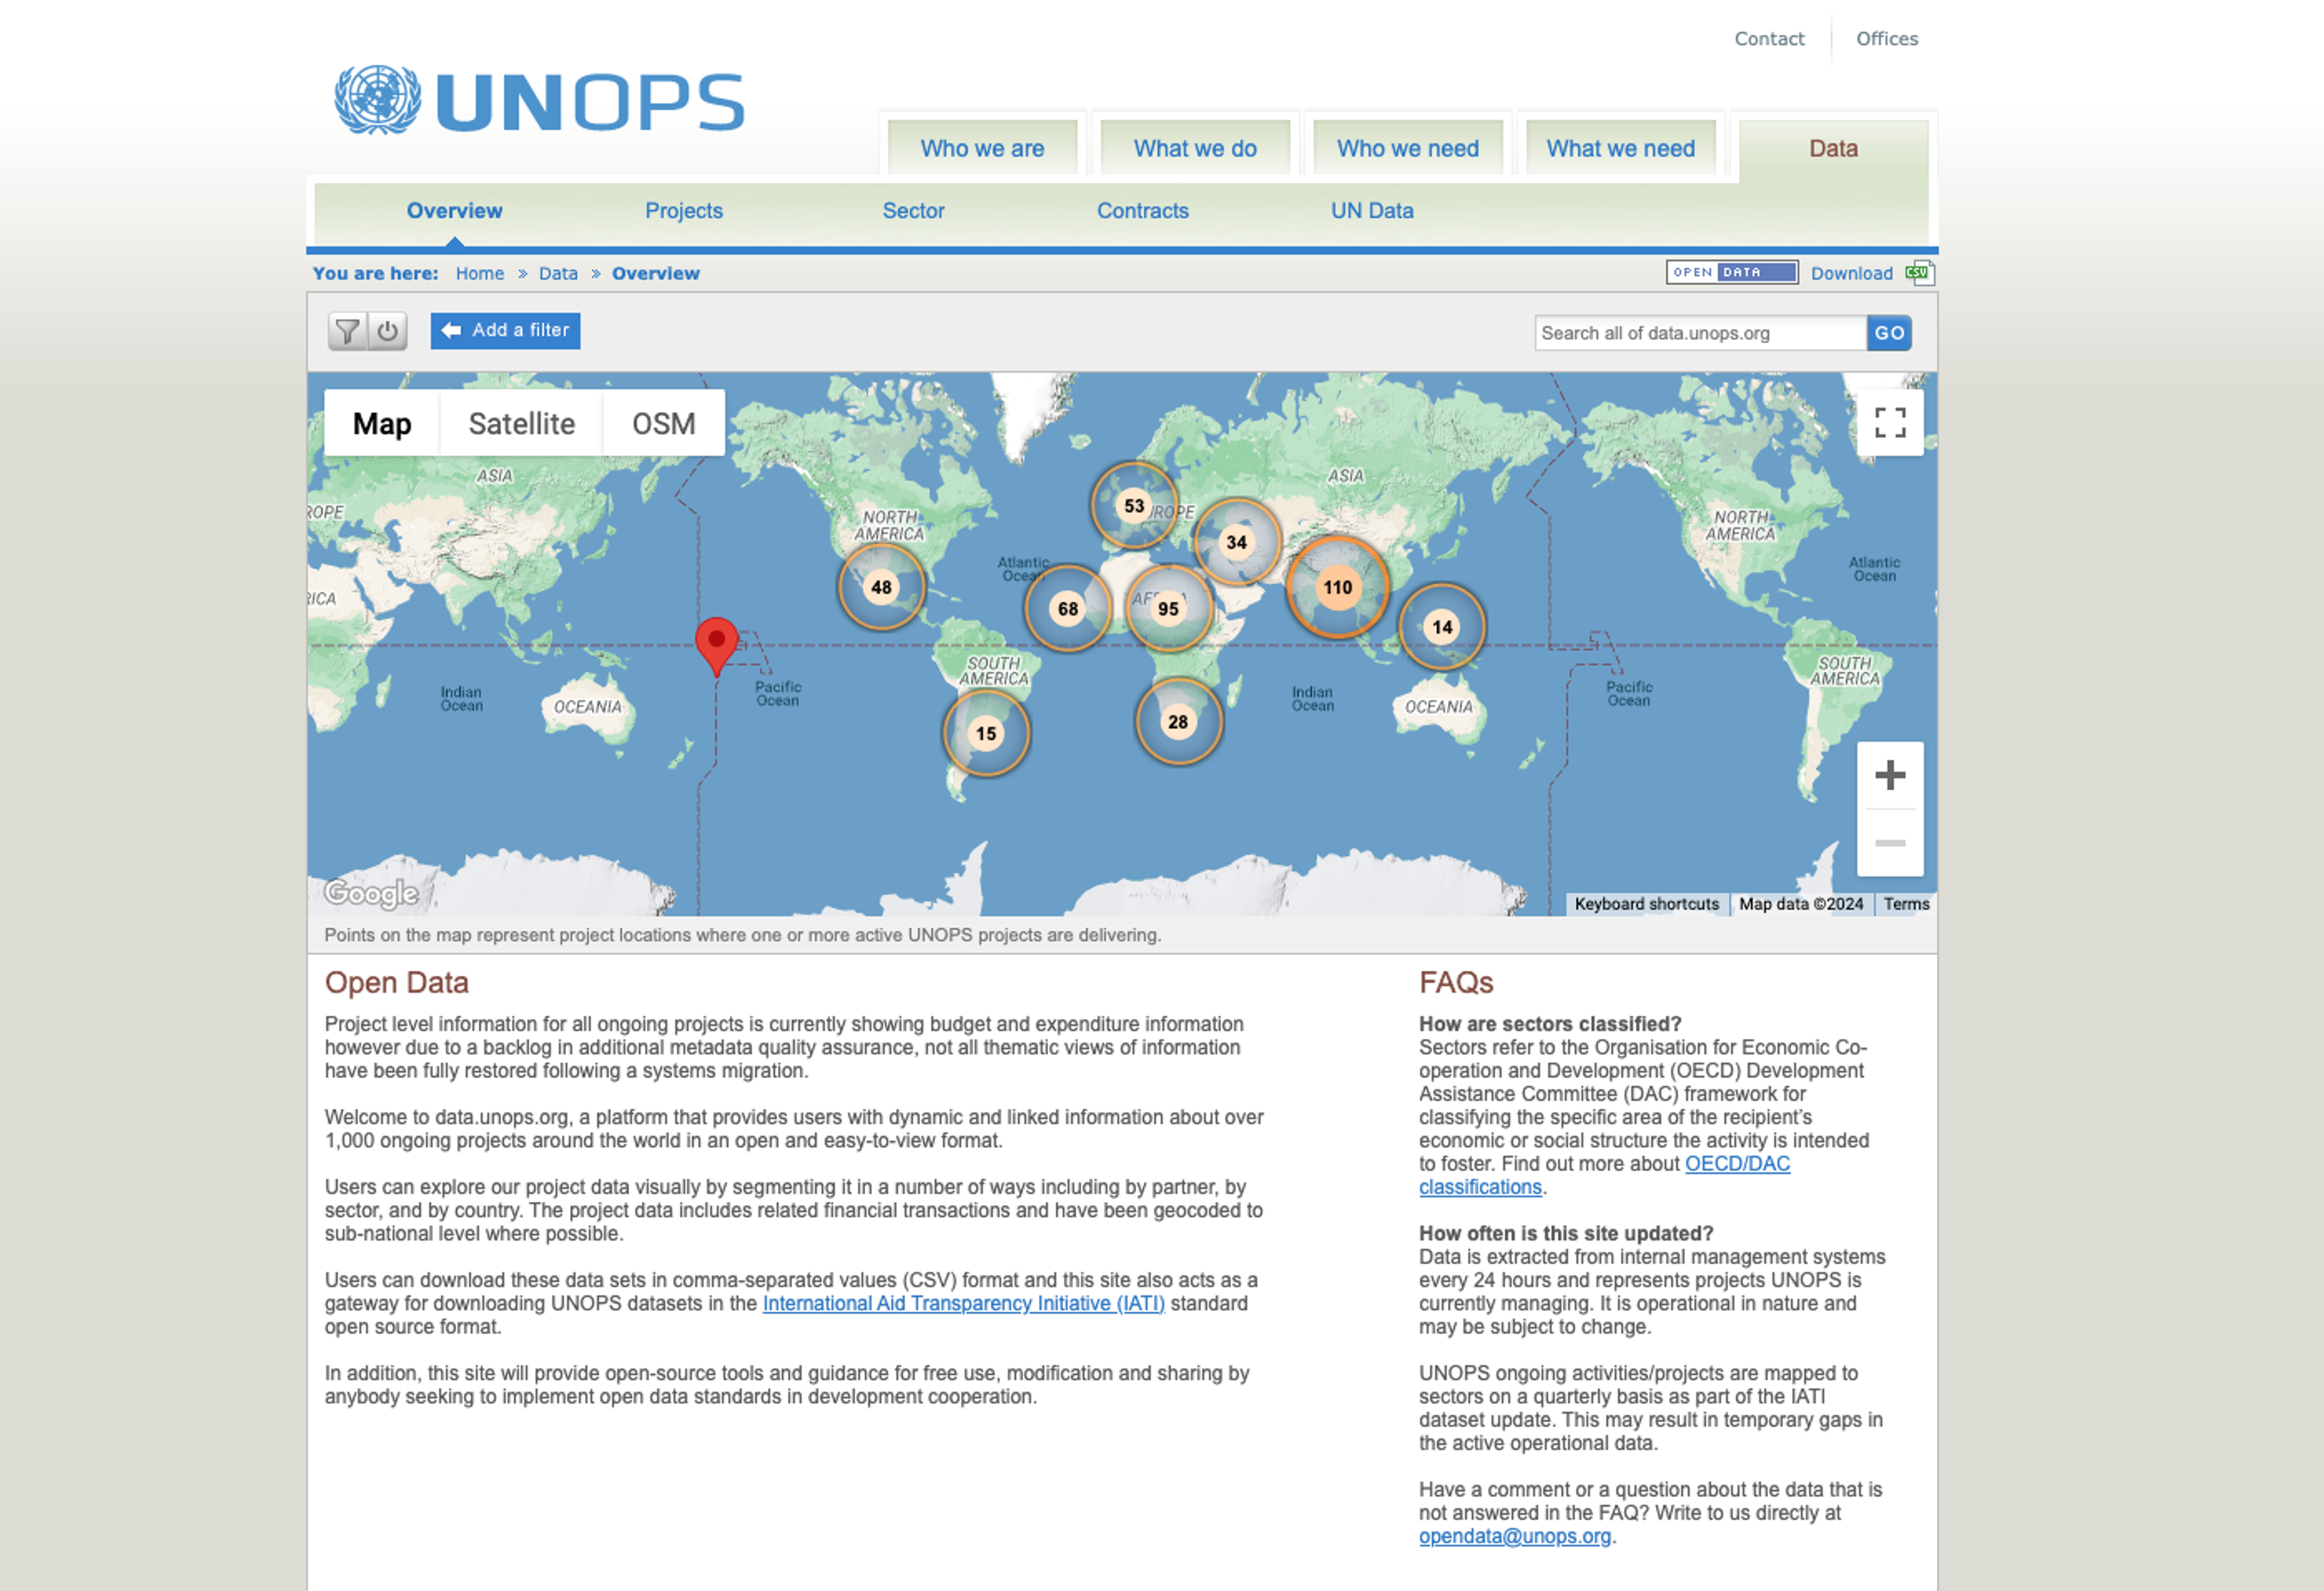
There's quite a lot of text on the screen and other visual elements competing for attention. The map displayed is quite small and repeats along the x axis.
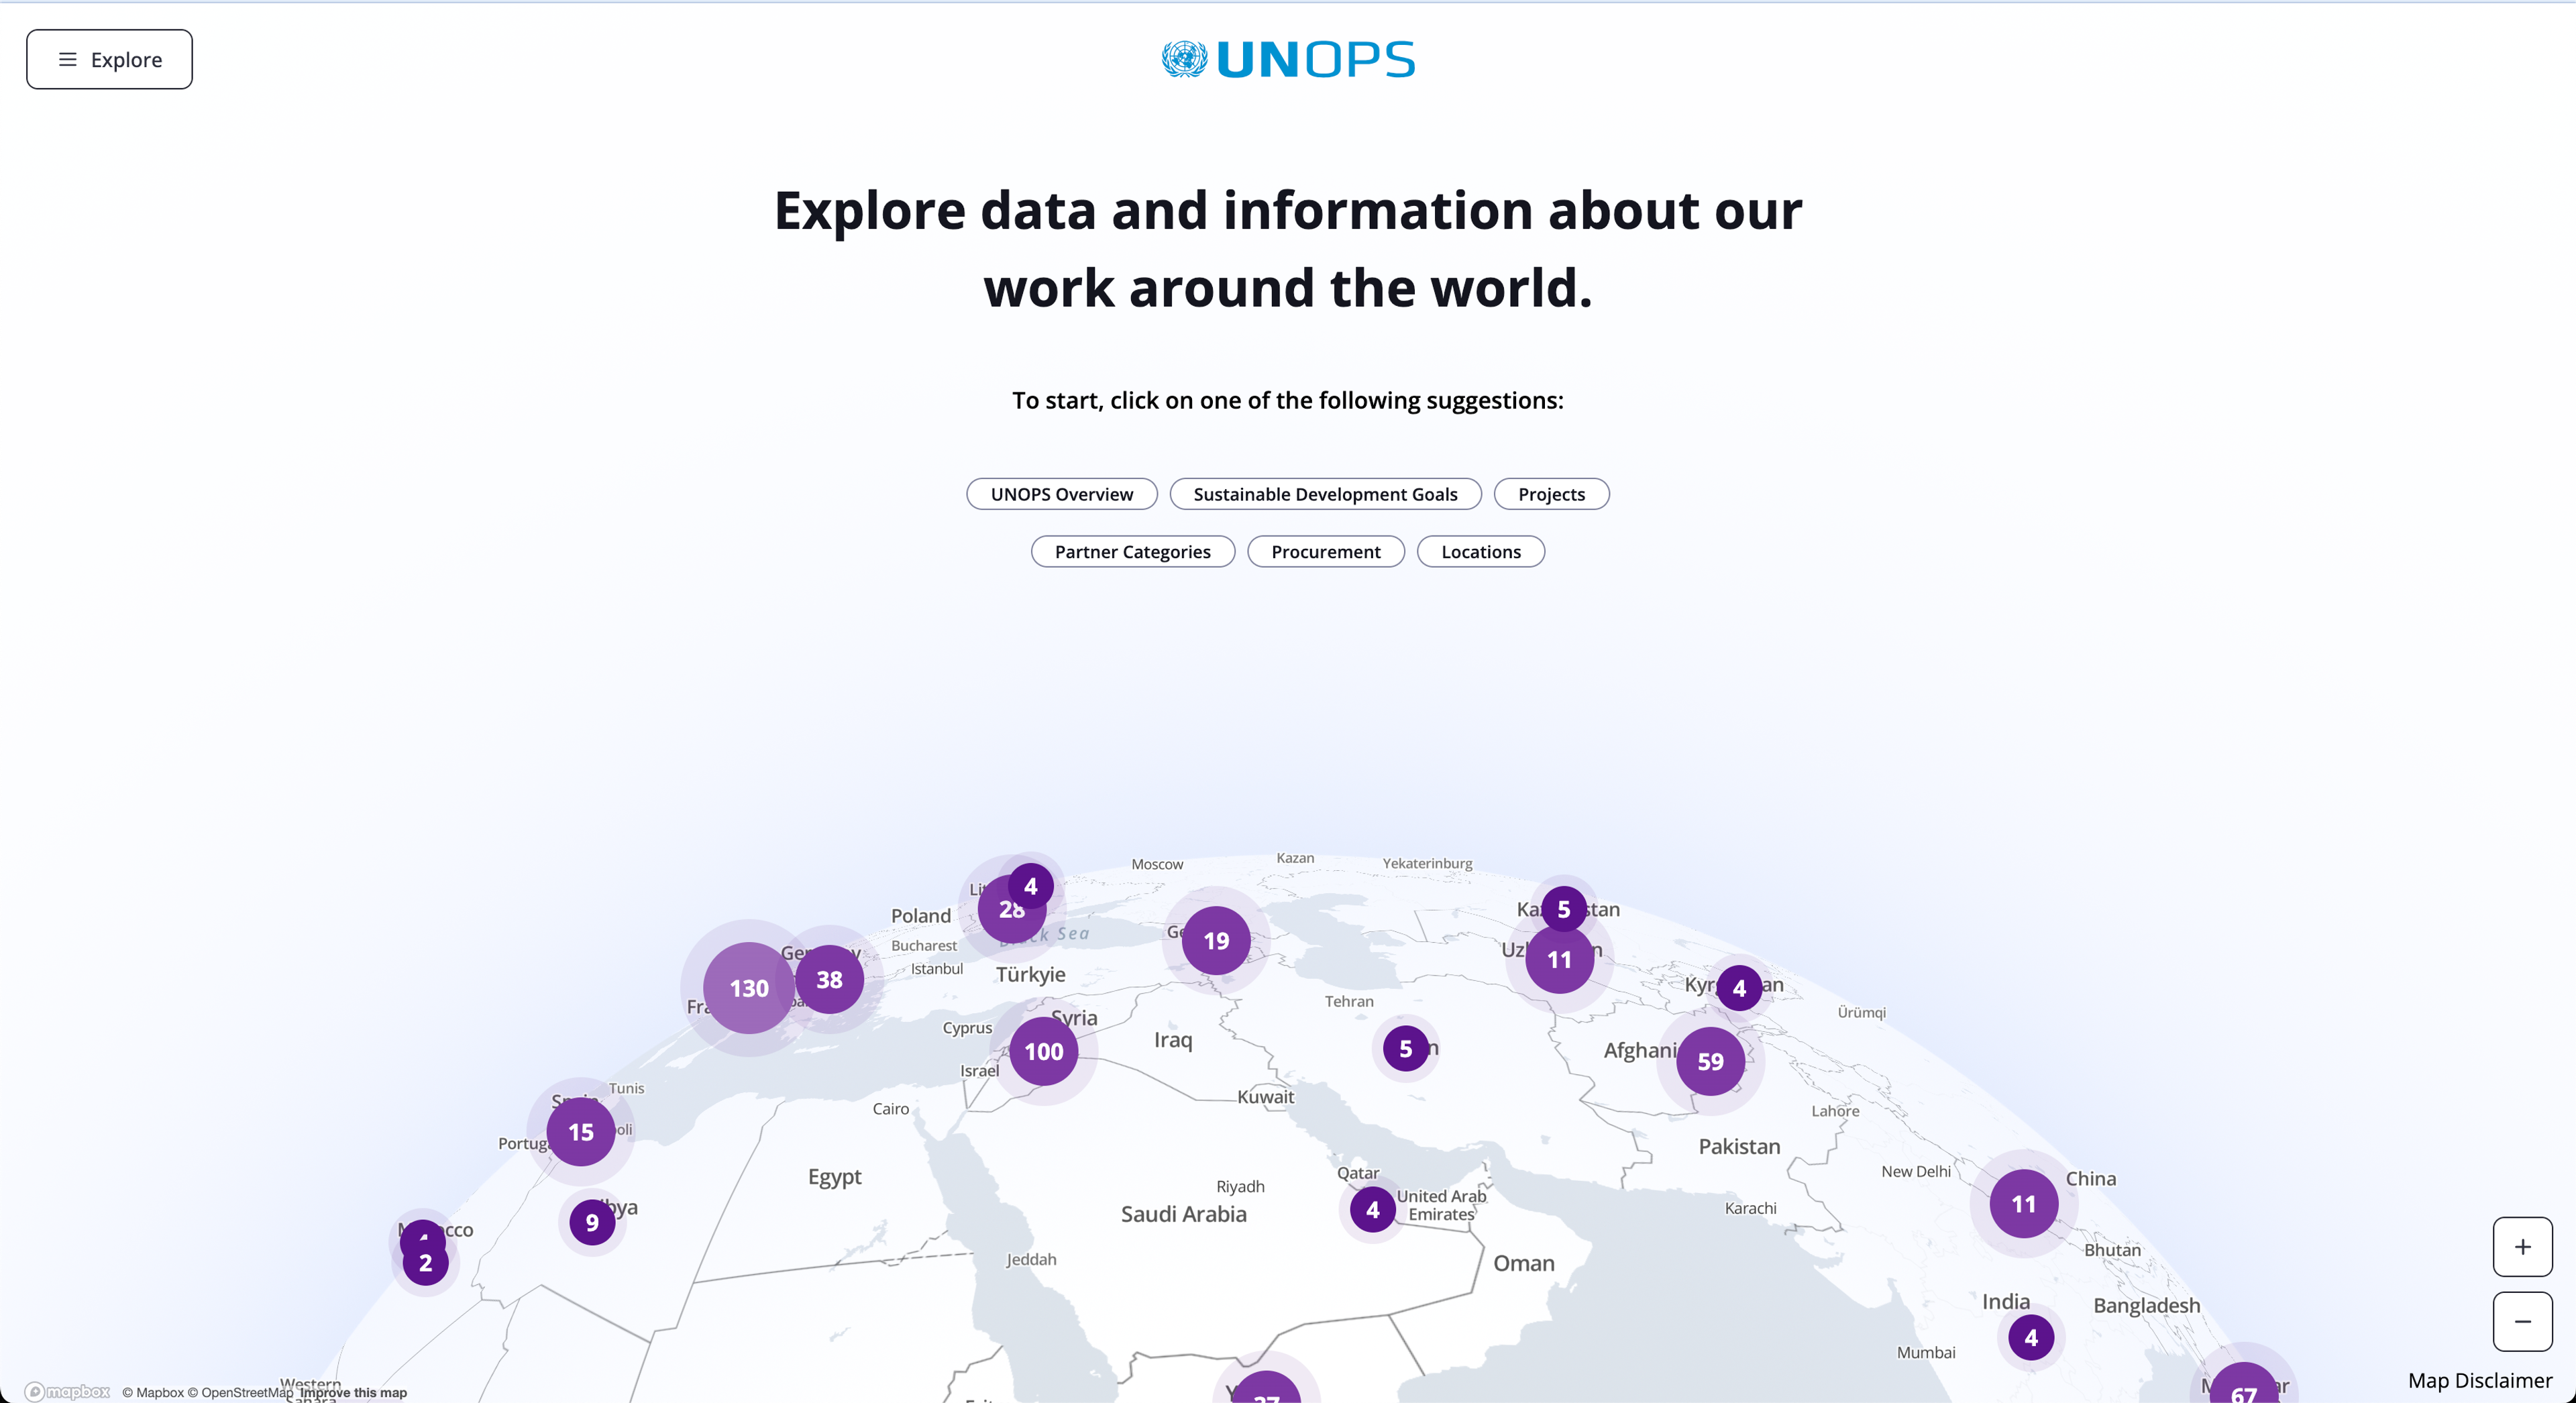
In the reimplementation the globe is fully manipulable and invites a playful interaction with the user. During user testing eye tracking, observation and user interviews highlighted the globe as a highly appealing feature.
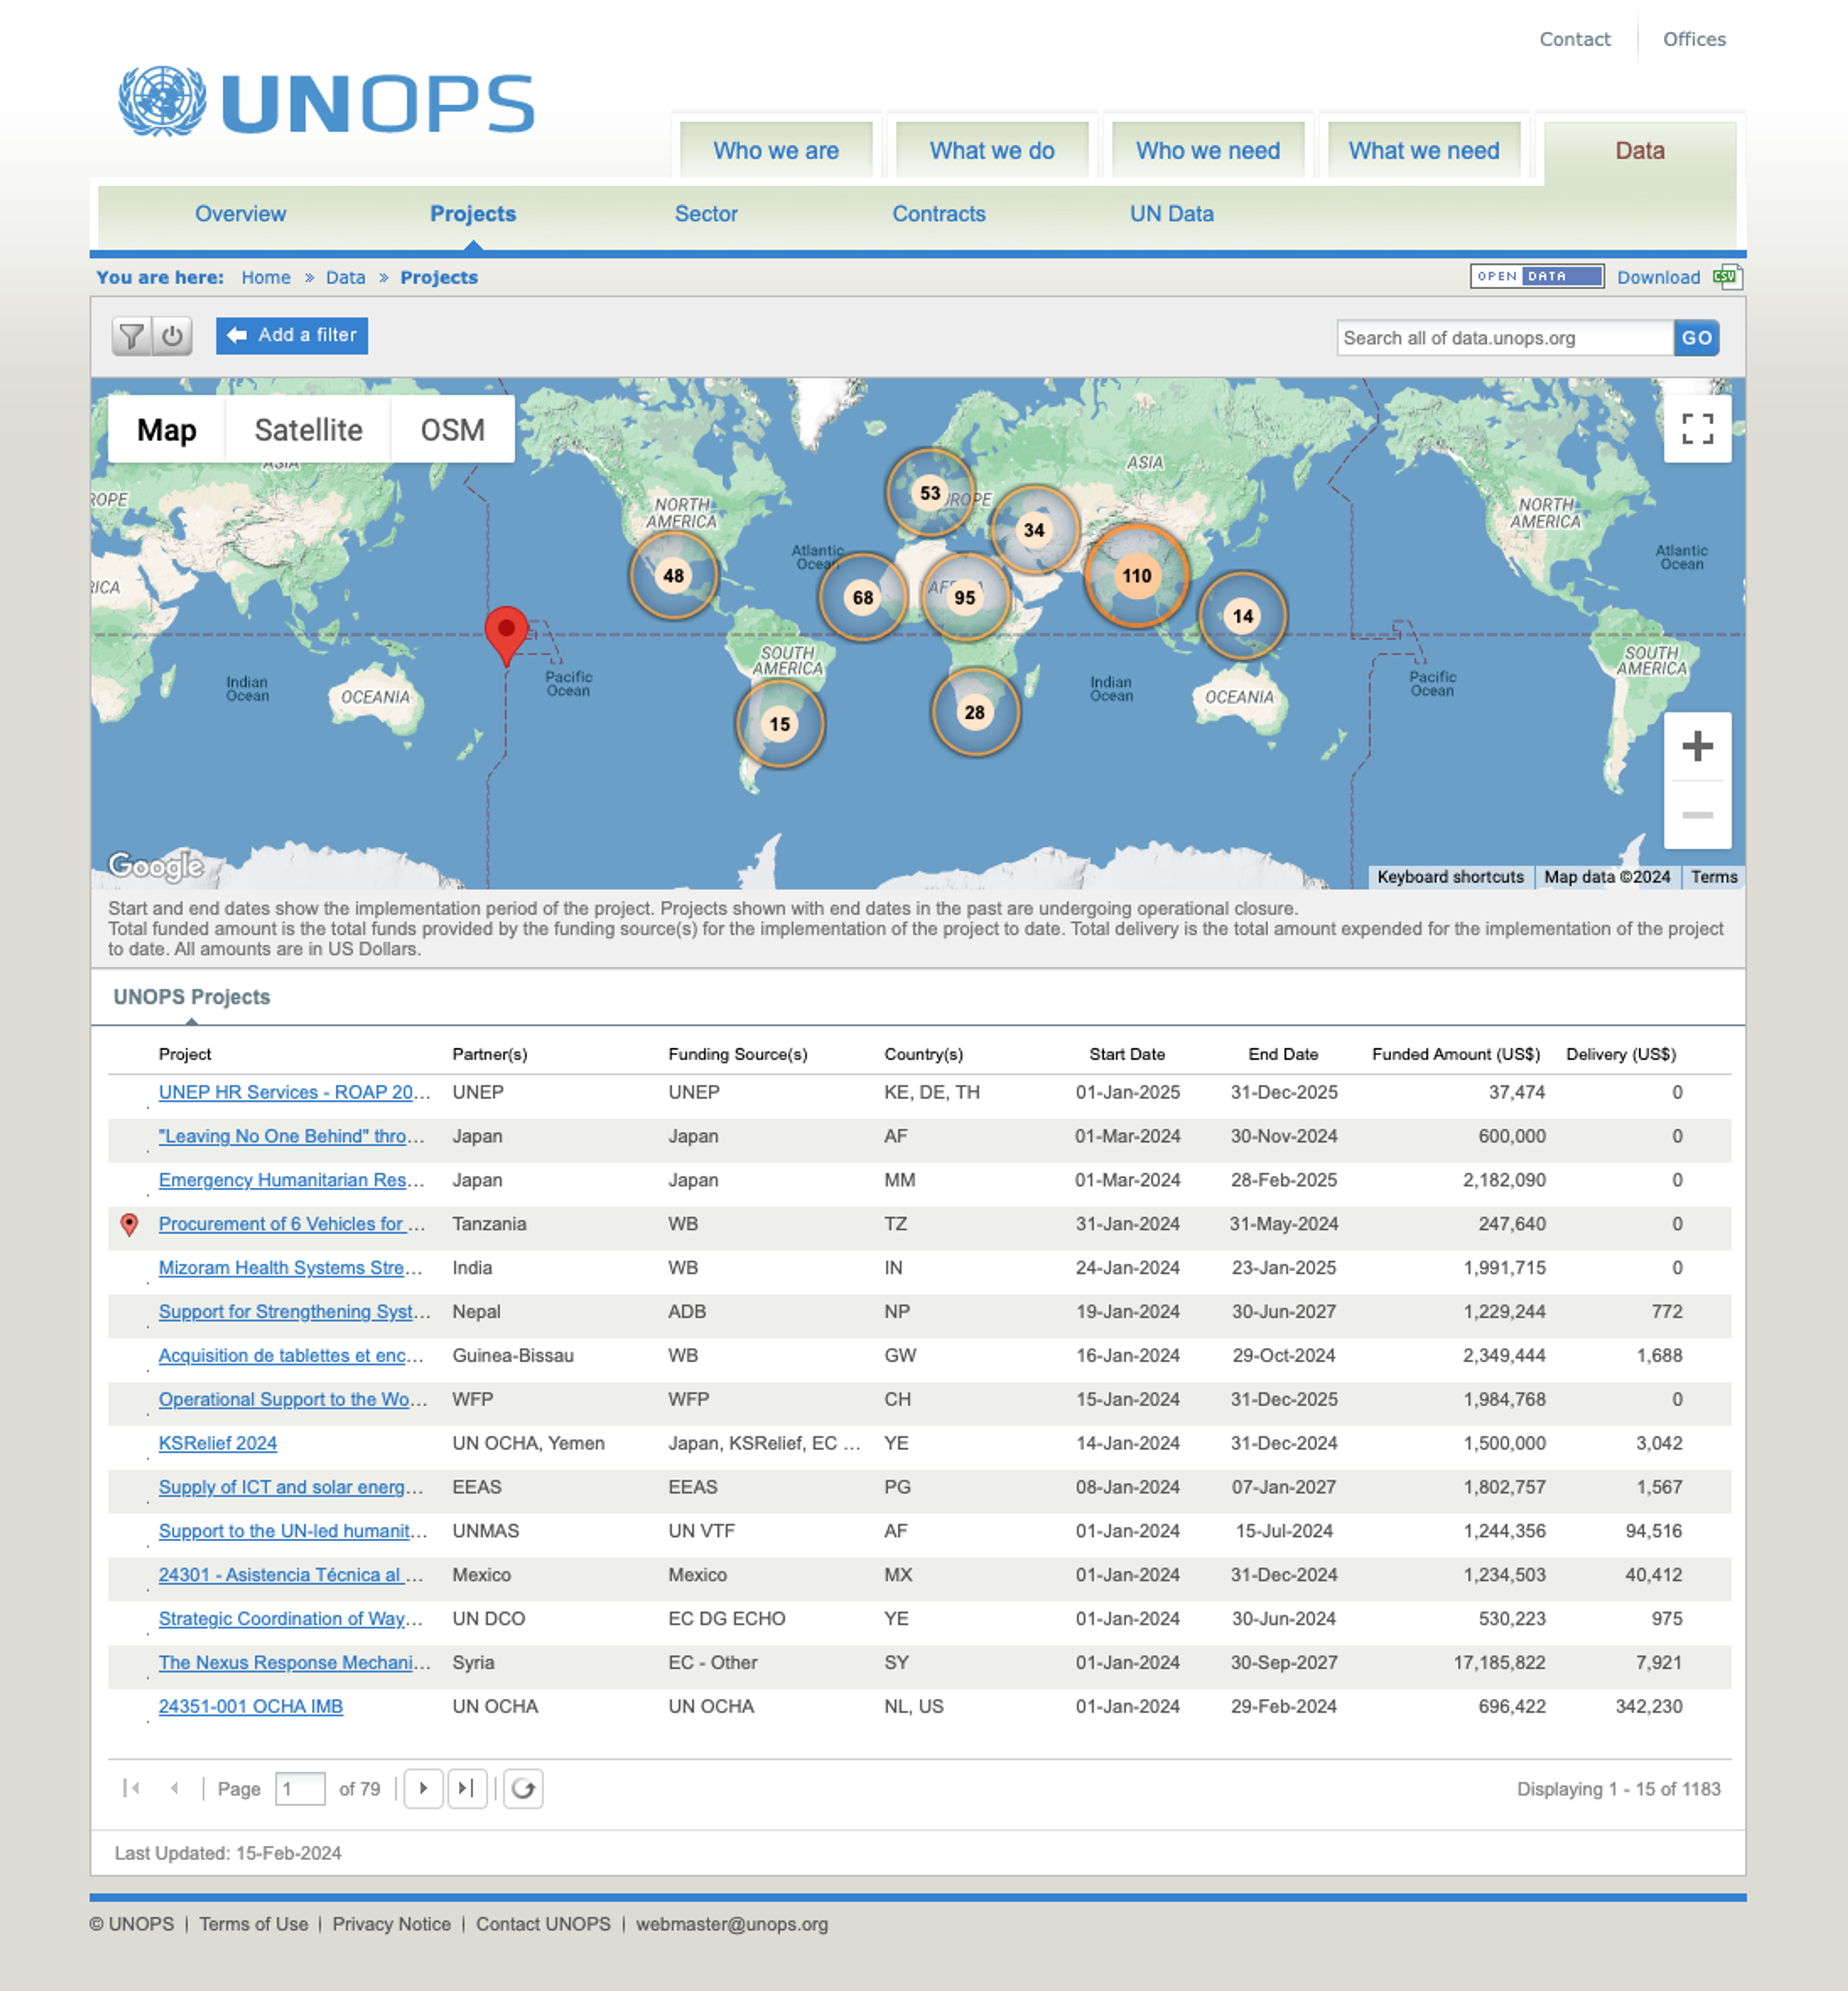
The map and the table compete for the user's attention. The table does not provide affordances, or other visual clues, to invite the user to manipulate the columns.
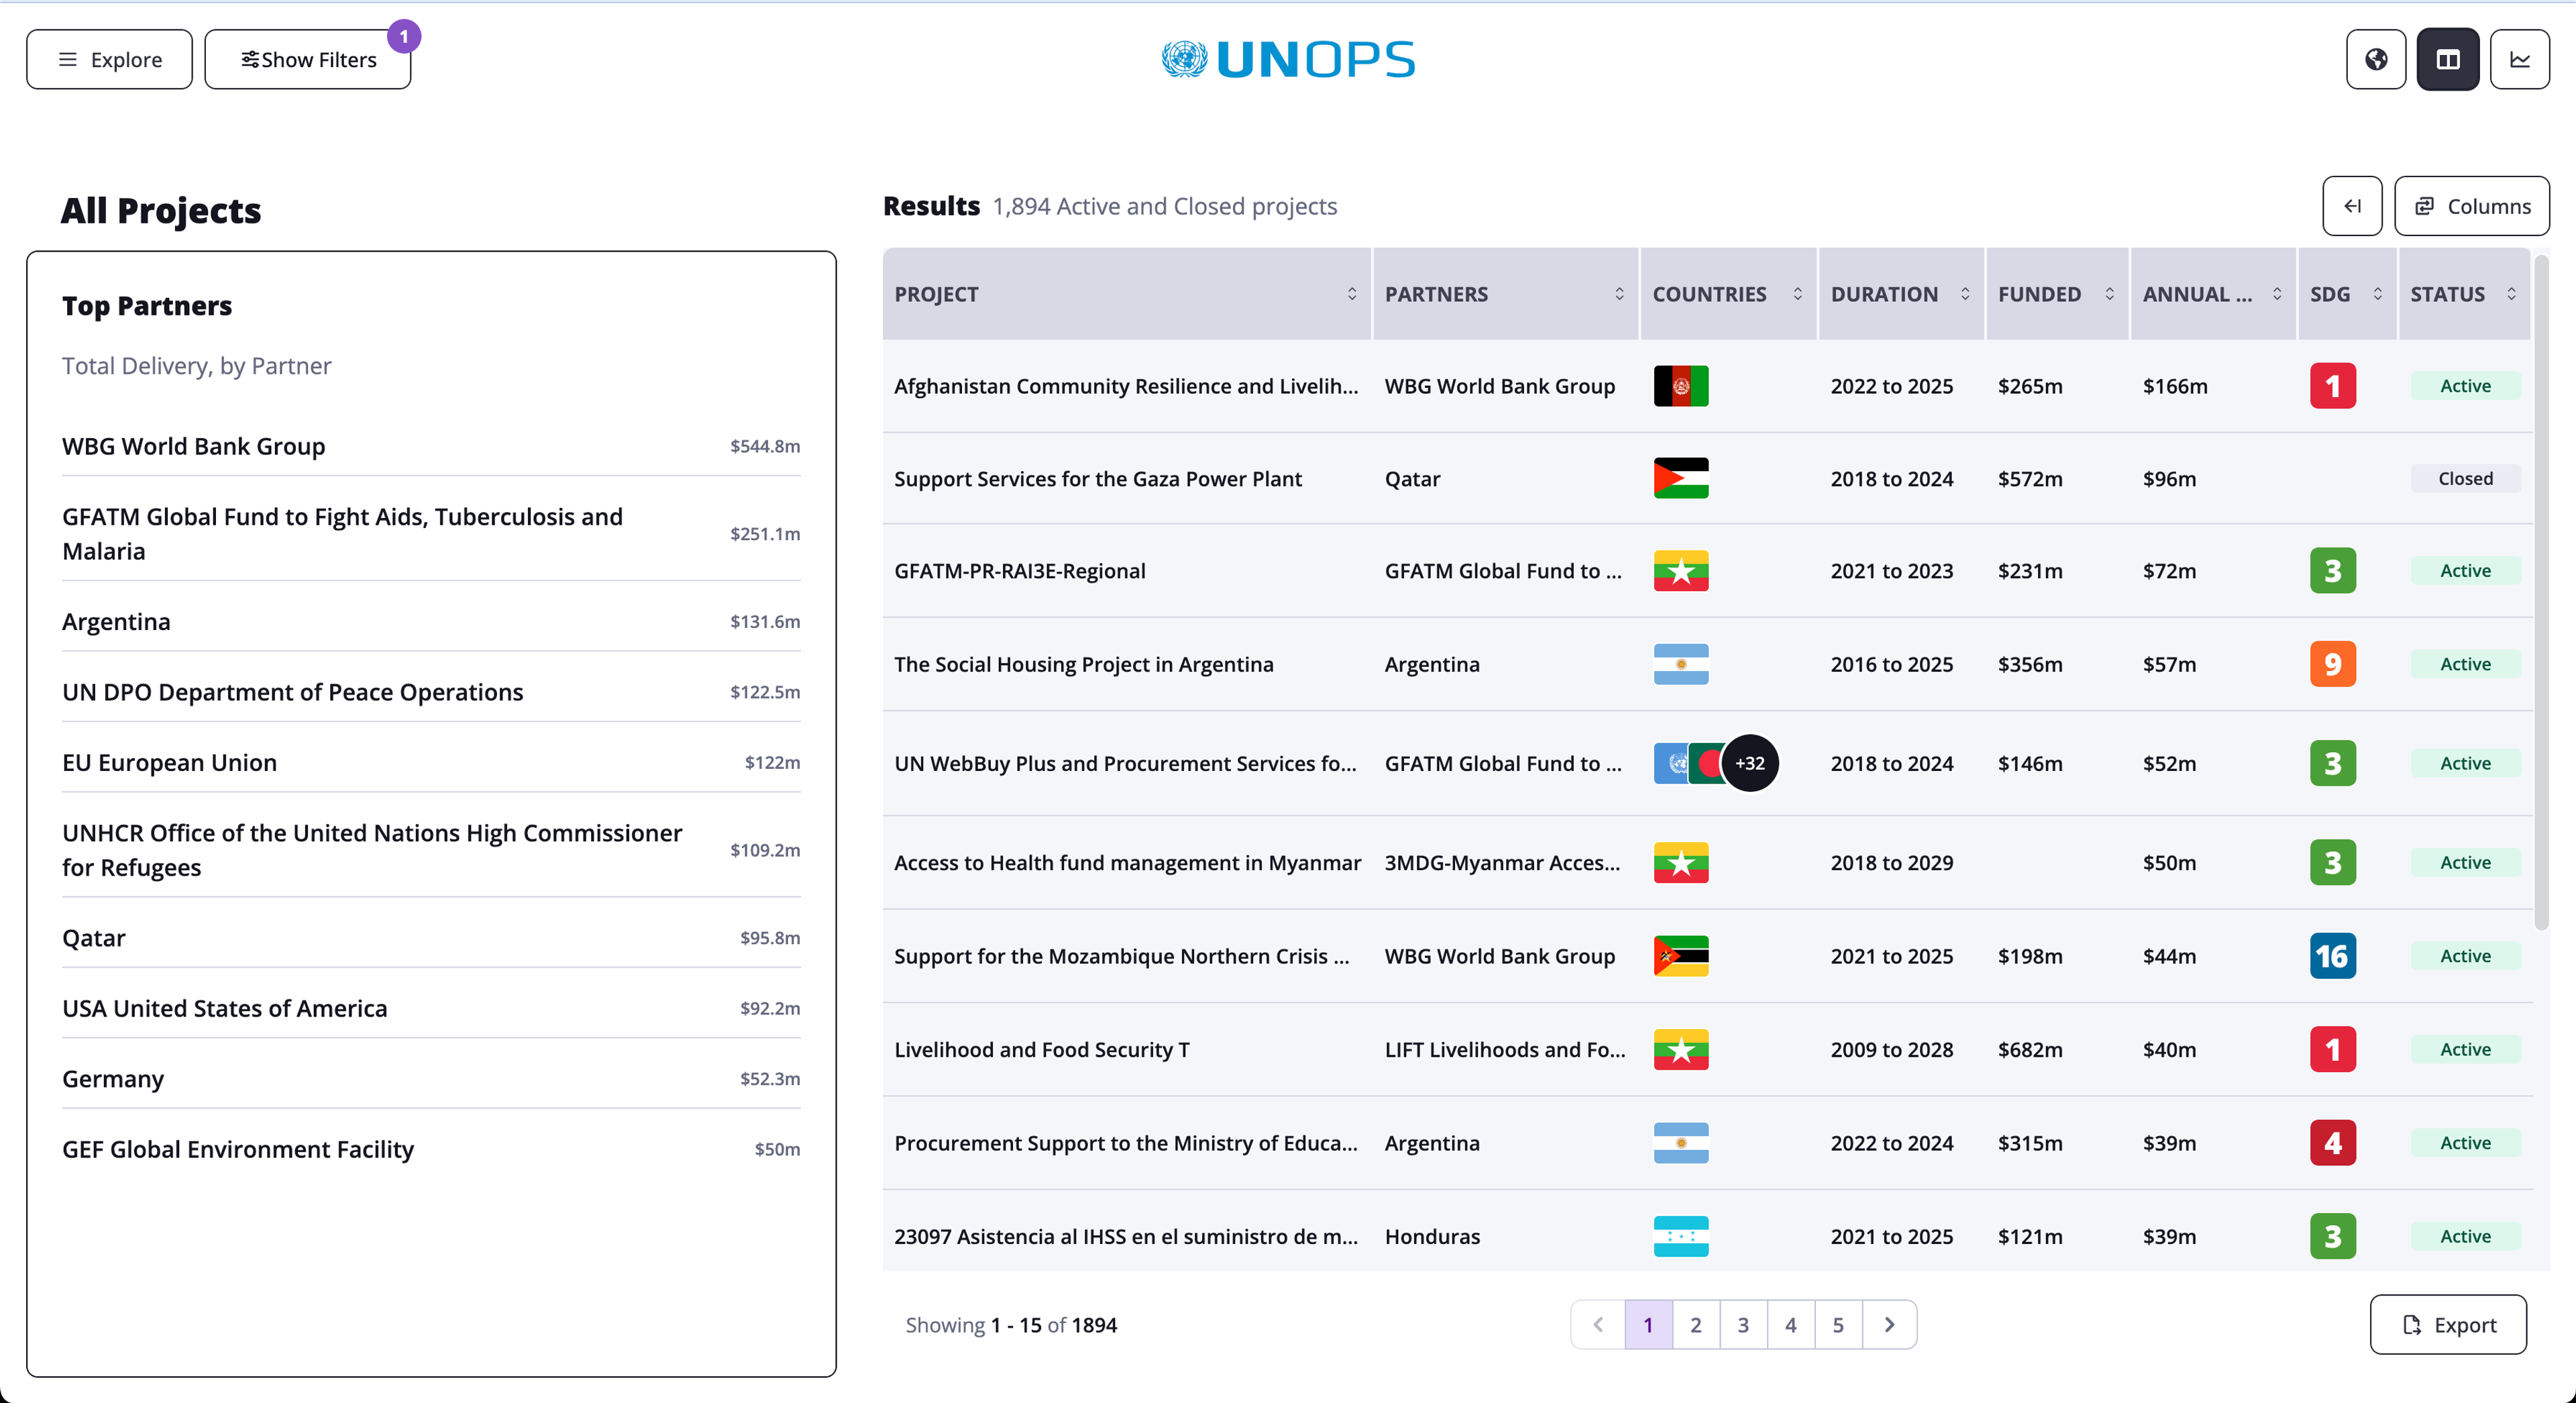
The redesign moved to a two column approach with the sidebar providing highlight, summary and supportive content. The inclusion of simplified SDG (Sustainable Development Goals) markers and flags allows for a little more information density without overwhelming the user. Further information is available by tooltip, the flags hidden by overflow are also shown on hover.
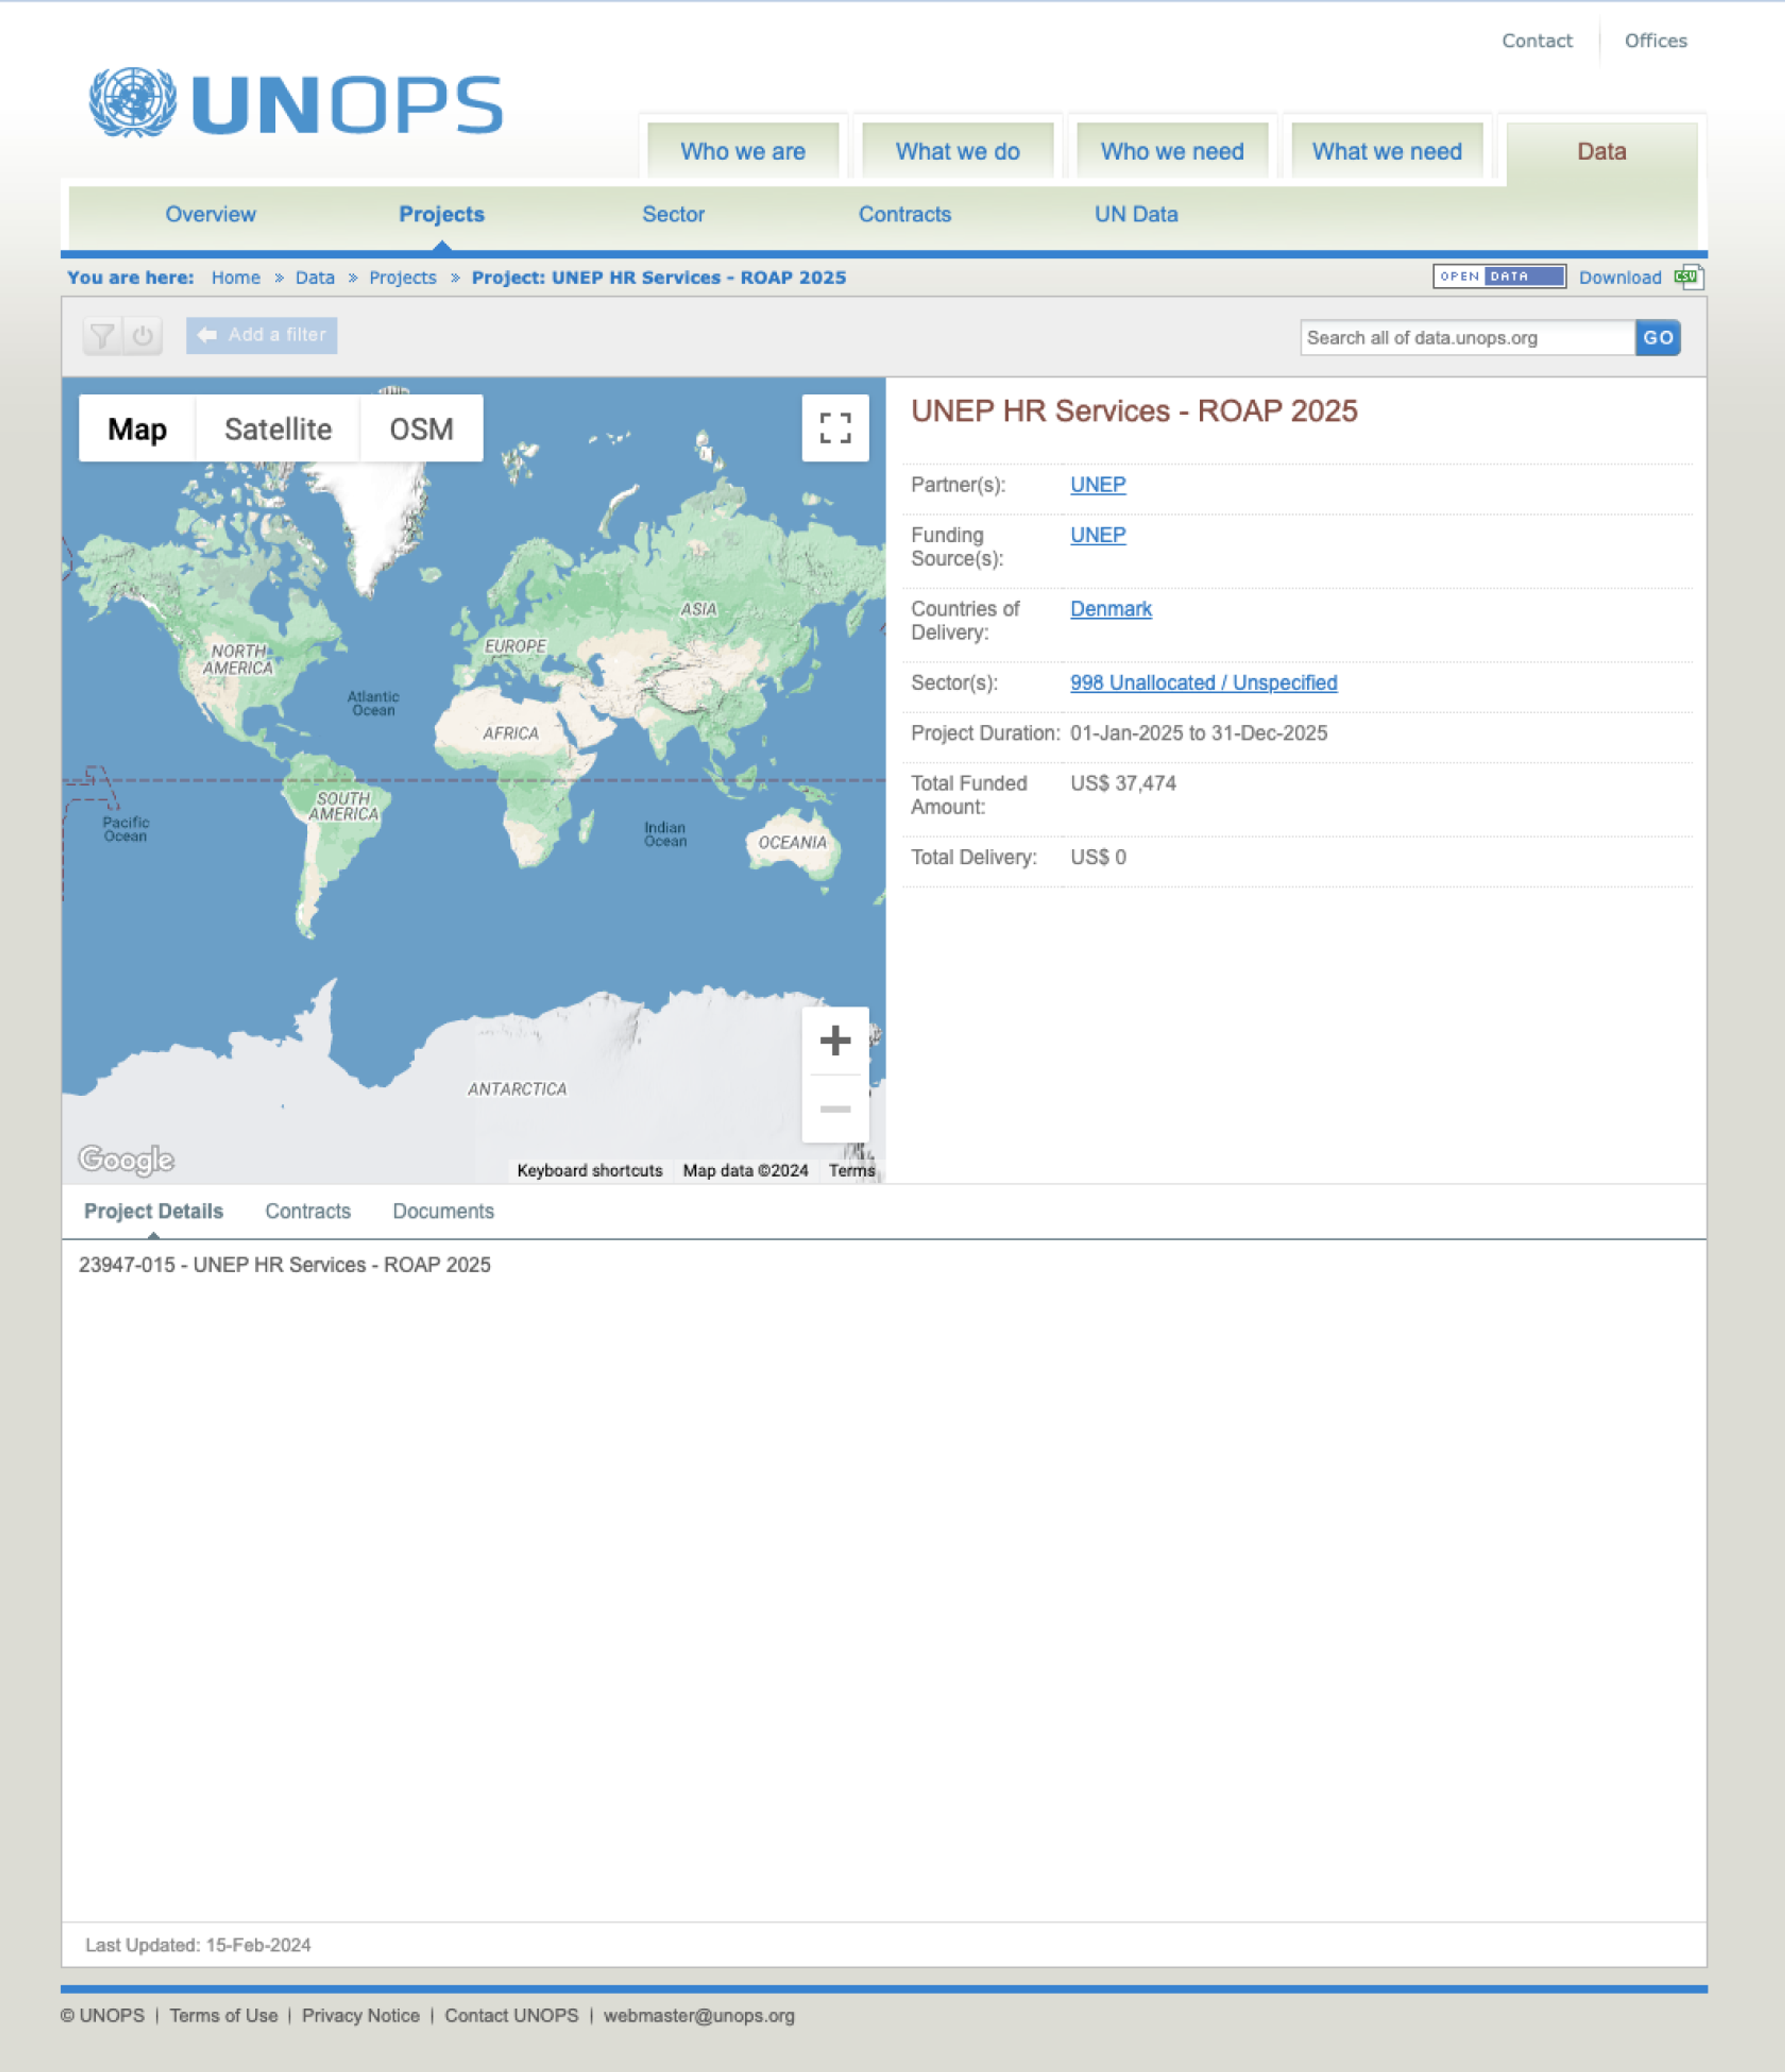
The map dominates the sparse details page, whilst the contracts and documents tabs toward the bottom contain tables of information the initial project details tab is very sparse. Overall the page lacks balance and is uninspiring.
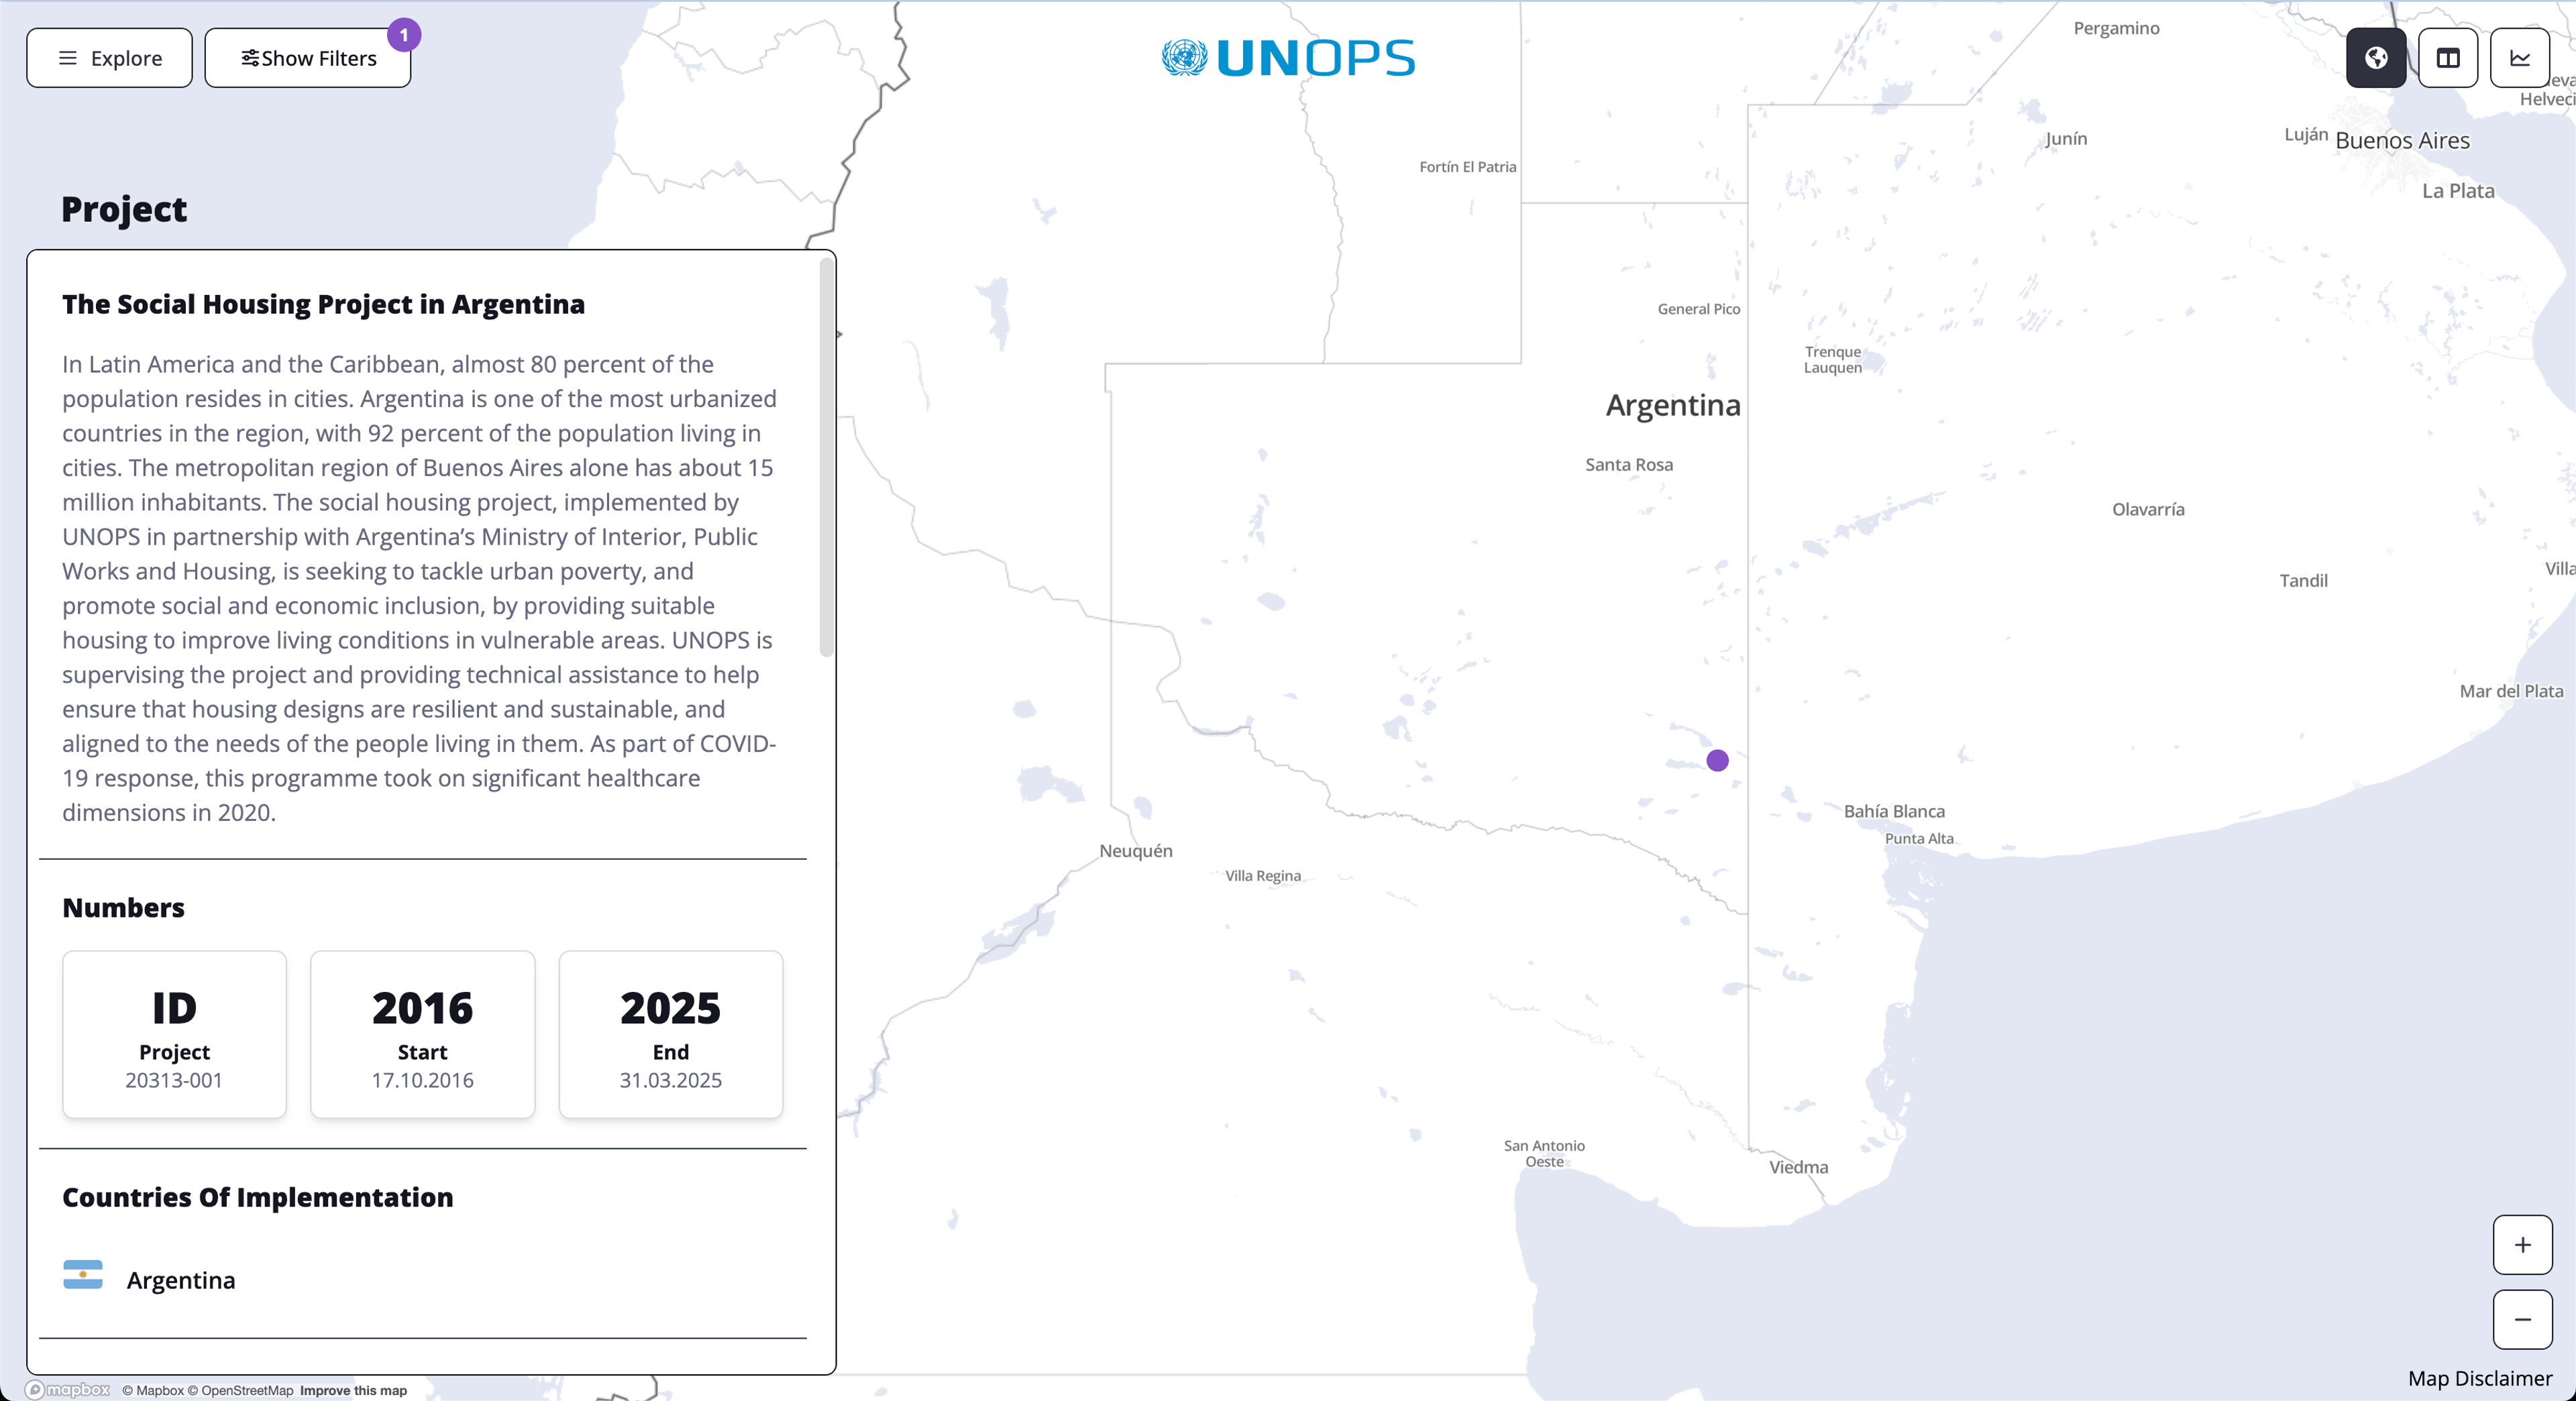
The globe "flies" from the user's location to the selected project's location to help the user contextualise the location. The map theme choice was a deliberate decision to minimise the use of extraneous colour and reduce the number of elements vying for attention.
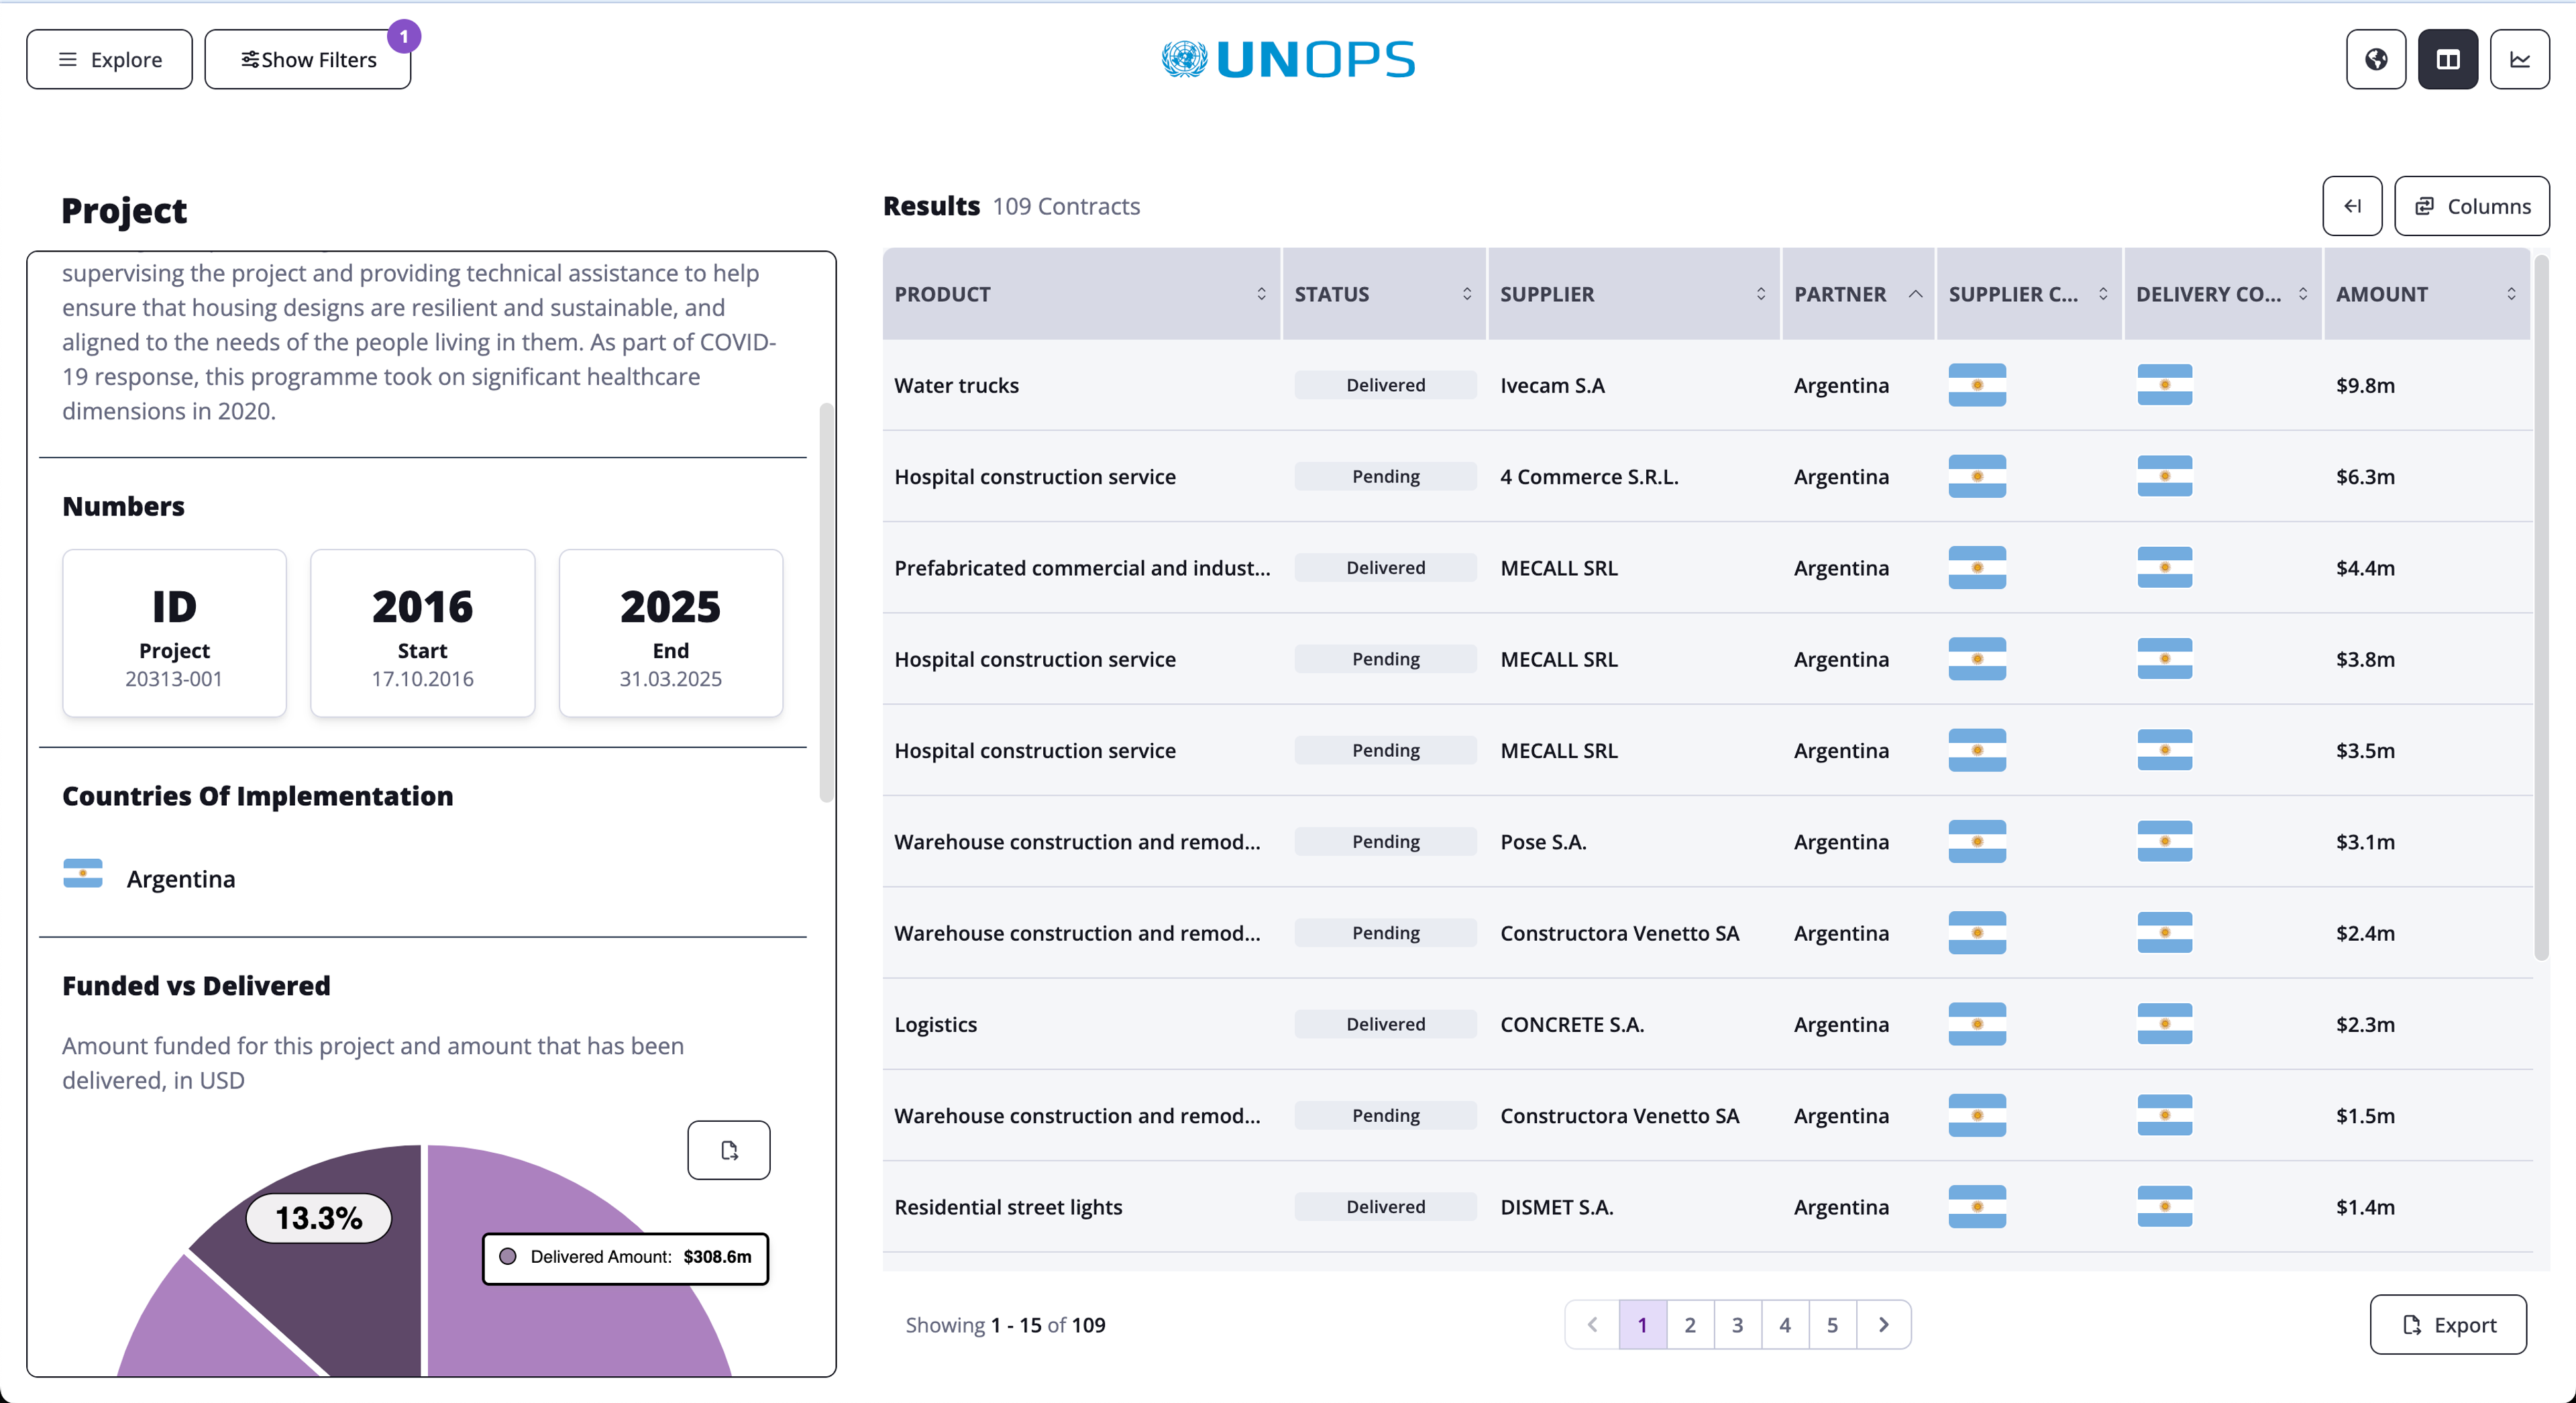
The table provides a means for the user to selective show and hide columns, the columns themselves are resizable and sortable. The table may be expanded fully - animating the side panel off of the left of the screen.
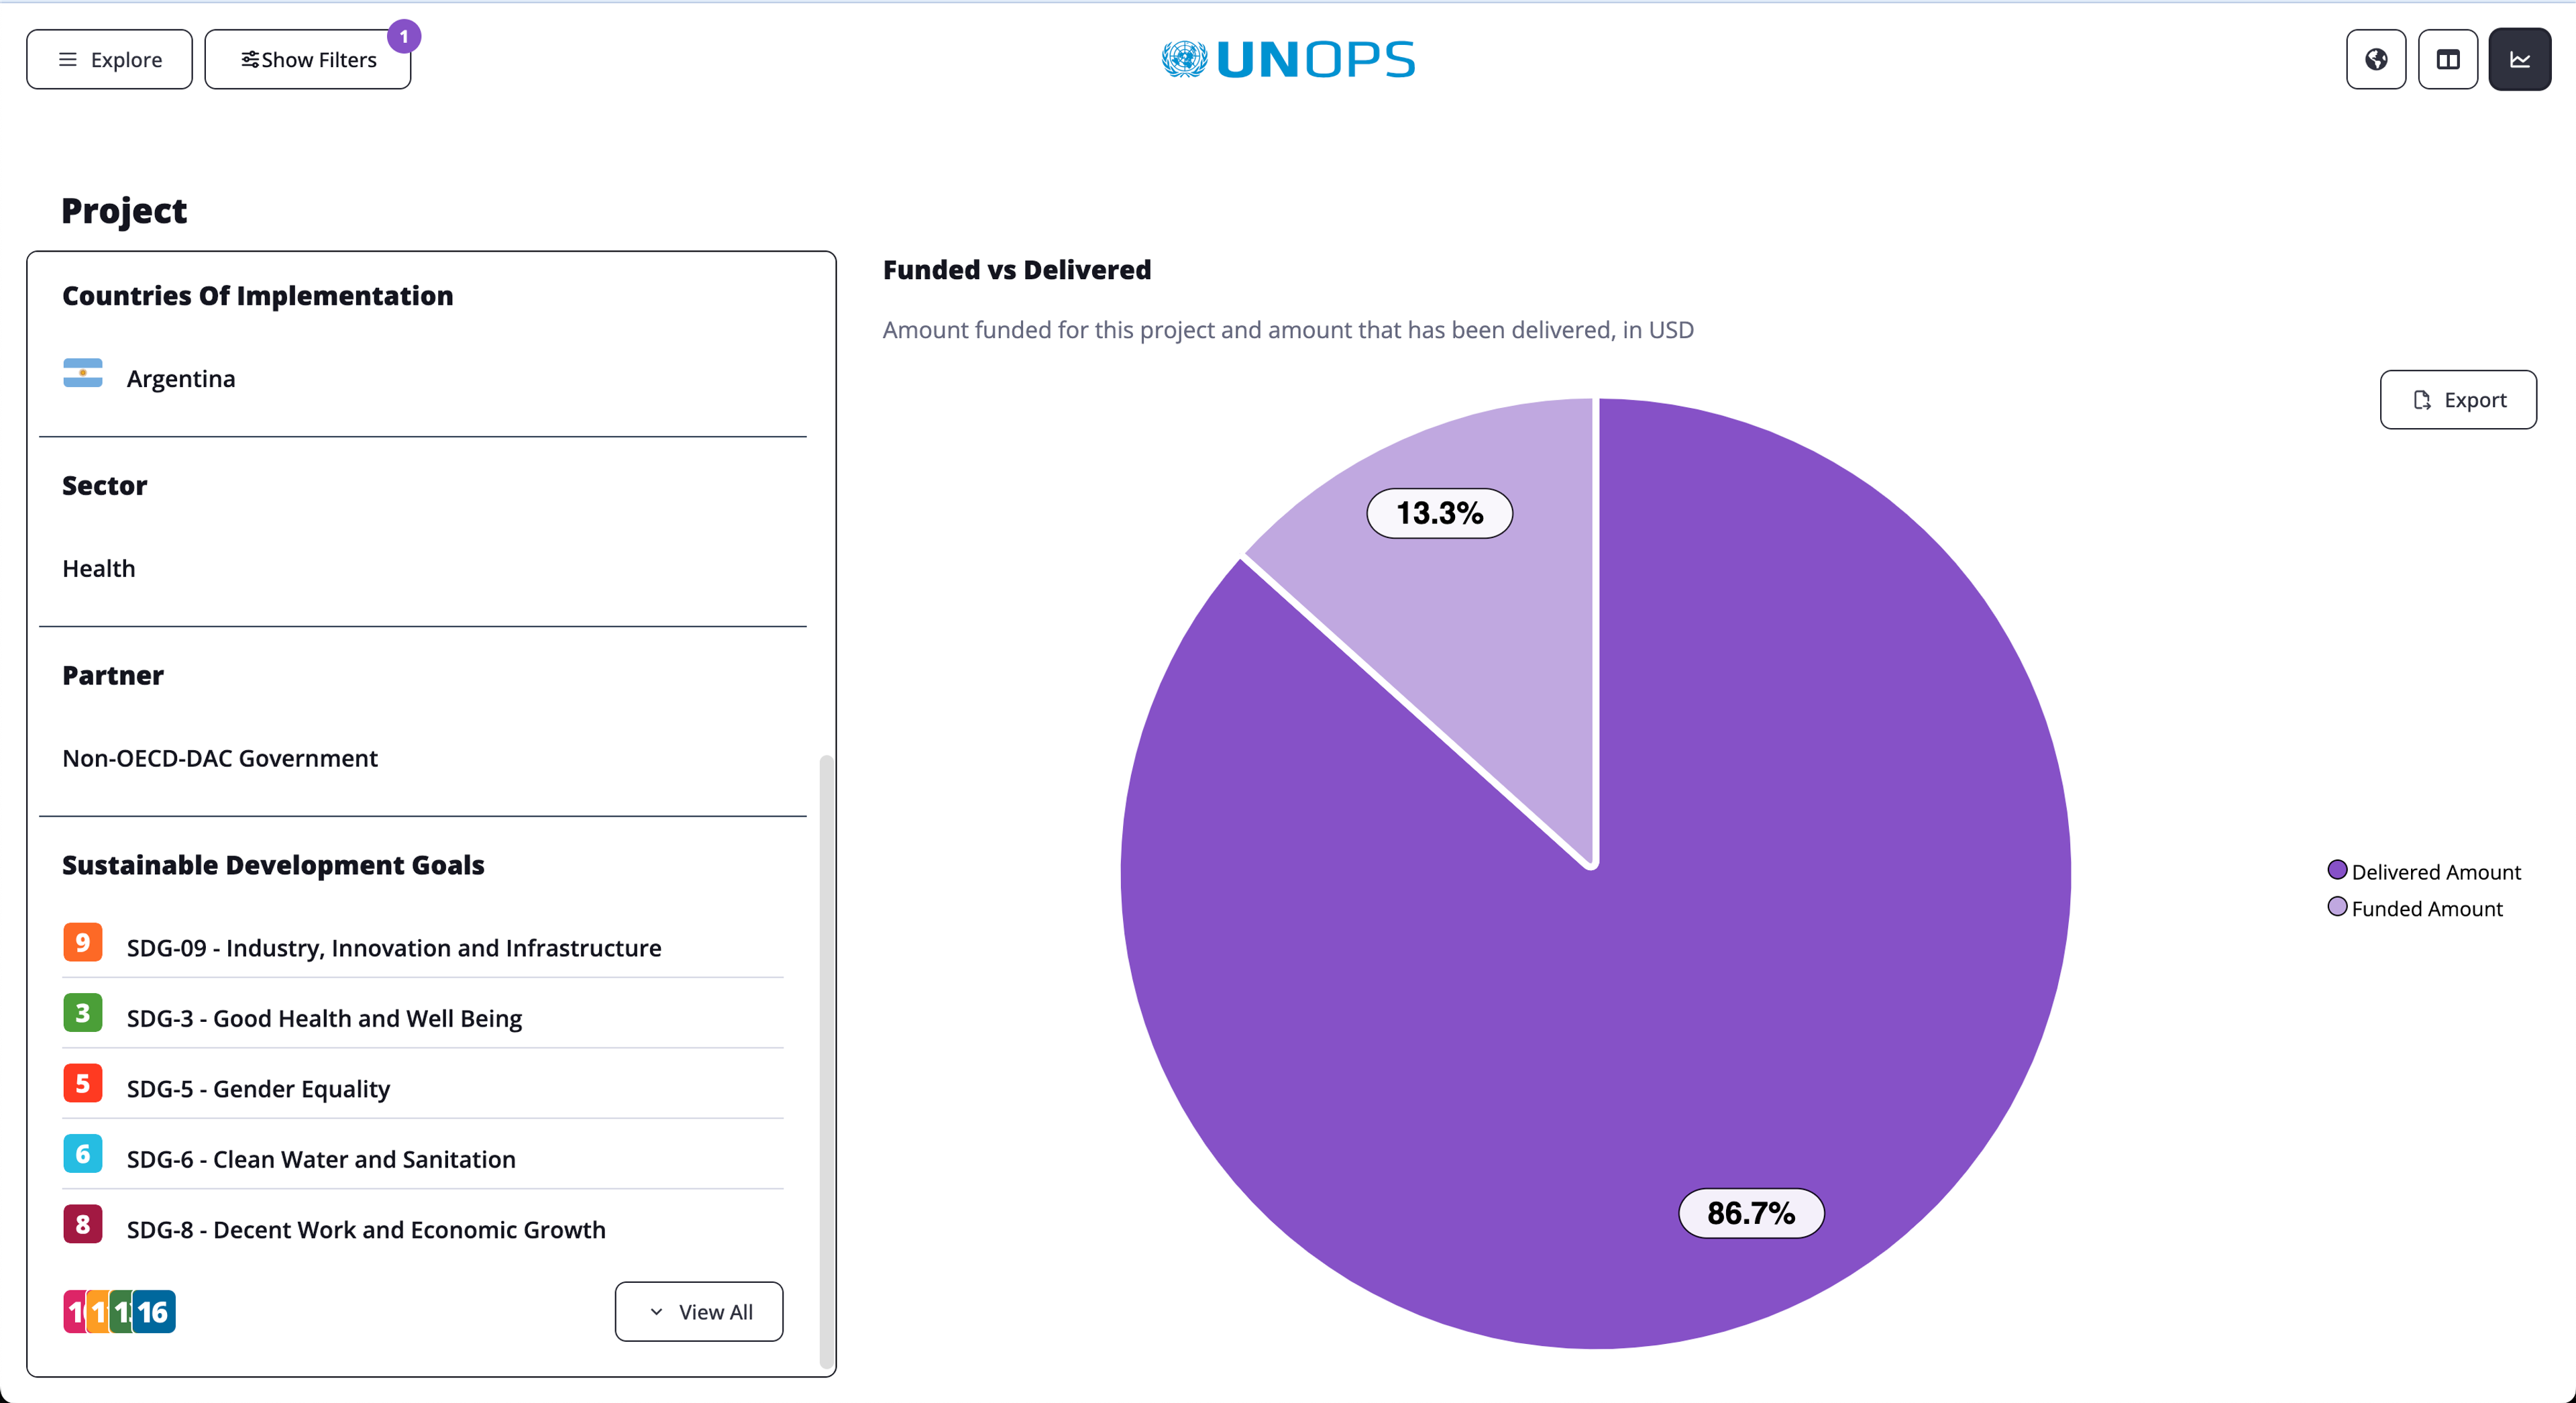
Pie chart is one of a range of chart types available in the product. The colour palettes used are thematic, aligning with different information types.


